The director’s commentary track for Daring Fireball. Long digressions on Apple, technology, design, movies, and more.
…
continue reading
Content provided by LessWrong. All podcast content including episodes, graphics, and podcast descriptions are uploaded and provided directly by LessWrong or their podcast platform partner. If you believe someone is using your copyrighted work without your permission, you can follow the process outlined here https://ppacc.player.fm/legal.
Player FM - Podcast App
Go offline with the Player FM app!
Go offline with the Player FM app!
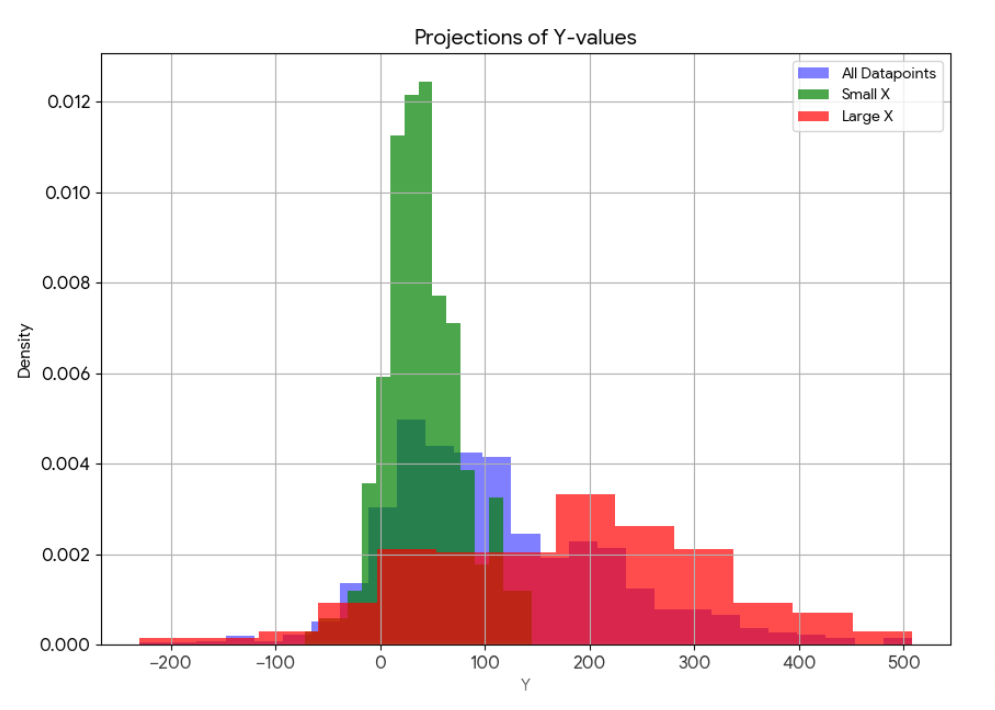
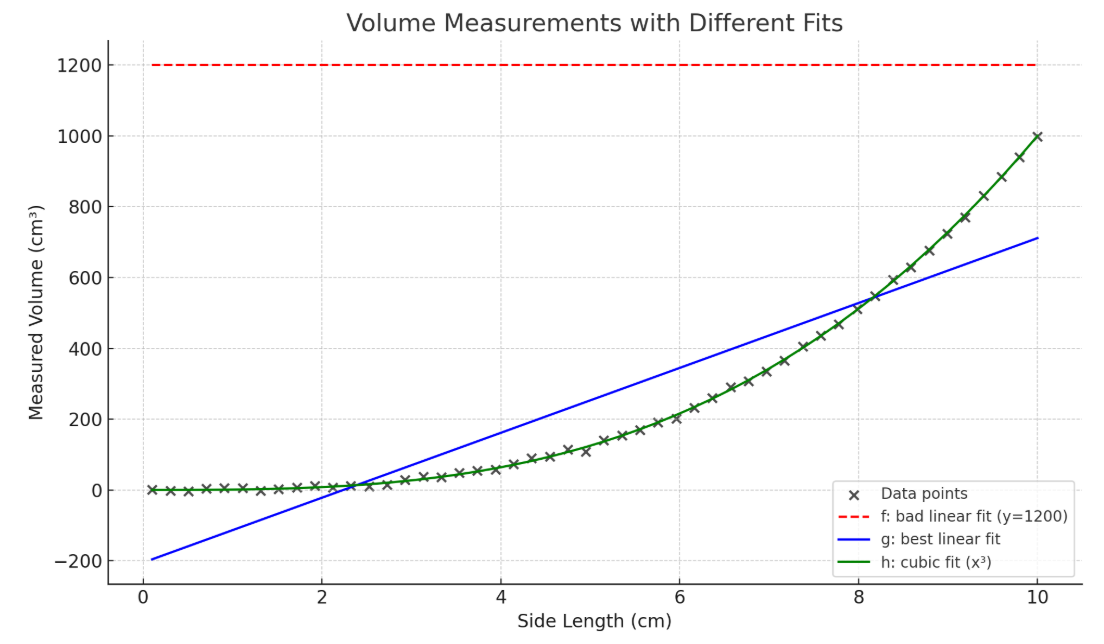
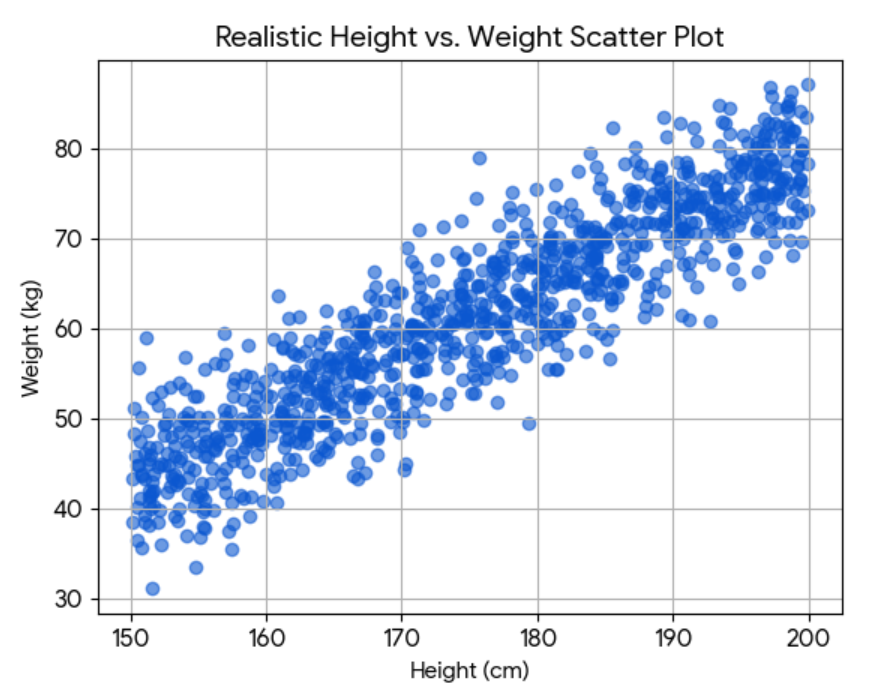
“X explains Z% of the variance in Y” by Leon Lang
Manage episode 491290462 series 3364760
Content provided by LessWrong. All podcast content including episodes, graphics, and podcast descriptions are uploaded and provided directly by LessWrong or their podcast platform partner. If you believe someone is using your copyrighted work without your permission, you can follow the process outlined here https://ppacc.player.fm/legal.
Audio note: this article contains 218 uses of latex notation, so the narration may be difficult to follow. There's a link to the original text in the episode description.
Recently, in a group chat with friends, someone posted this Lesswrong post and quoted:
The group consensus on somebody's attractiveness accounted for roughly 60% of the variance in people's perceptions of the person's relative attractiveness.
I answered that, embarrassingly, even after reading Spencer Greenberg's tweets for years, I don't actually know what it means when one says:
_X_ explains _p_ of the variance in _Y_.[1]
What followed was a vigorous discussion about the correct definition, and several links to external sources like Wikipedia. Sadly, it seems to me that all online explanations (e.g. on Wikipedia here and here), while precise, seem philosophically wrong since they confuse the platonic concept of explained variance with the variance explained by [...]
---
Outline:
(02:38) Definitions
(02:41) The verbal definition
(05:51) The mathematical definition
(09:29) How to approximate _1 - p_
(09:41) When you have lots of data
(10:45) When you have less data: Regression
(12:59) Examples
(13:23) Dependence on the regression model
(14:59) When you have incomplete data: Twin studies
(17:11) Conclusion
The original text contained 6 footnotes which were omitted from this narration.
---
First published:
June 20th, 2025
Source:
https://www.lesswrong.com/posts/E3nsbq2tiBv6GLqjB/x-explains-z-of-the-variance-in-y
---
Narrated by TYPE III AUDIO.
---
…
continue reading
Recently, in a group chat with friends, someone posted this Lesswrong post and quoted:
The group consensus on somebody's attractiveness accounted for roughly 60% of the variance in people's perceptions of the person's relative attractiveness.
I answered that, embarrassingly, even after reading Spencer Greenberg's tweets for years, I don't actually know what it means when one says:
_X_ explains _p_ of the variance in _Y_.[1]
What followed was a vigorous discussion about the correct definition, and several links to external sources like Wikipedia. Sadly, it seems to me that all online explanations (e.g. on Wikipedia here and here), while precise, seem philosophically wrong since they confuse the platonic concept of explained variance with the variance explained by [...]
---
Outline:
(02:38) Definitions
(02:41) The verbal definition
(05:51) The mathematical definition
(09:29) How to approximate _1 - p_
(09:41) When you have lots of data
(10:45) When you have less data: Regression
(12:59) Examples
(13:23) Dependence on the regression model
(14:59) When you have incomplete data: Twin studies
(17:11) Conclusion
The original text contained 6 footnotes which were omitted from this narration.
---
First published:
June 20th, 2025
Source:
https://www.lesswrong.com/posts/E3nsbq2tiBv6GLqjB/x-explains-z-of-the-variance-in-y
---
Narrated by TYPE III AUDIO.
---
598 episodes
All episodes
×Welcome to Player FM!
Player FM is scanning the web for high-quality podcasts for you to enjoy right now. It's the best podcast app and works on Android, iPhone, and the web. Signup to sync subscriptions across devices.


