Show notes are at https://stevelitchfield.com/sshow/chat.html
…
continue reading
Content provided by EA Forum Team. All podcast content including episodes, graphics, and podcast descriptions are uploaded and provided directly by EA Forum Team or their podcast platform partner. If you believe someone is using your copyrighted work without your permission, you can follow the process outlined here https://ppacc.player.fm/legal.
Similar to EA Forum Podcast (Curated & popular)
The power of Data is undeniable. And unharnessed - it’s nothing but chaos. Making data your ally. Using it to lead with confidence and clarity. Host Jess Carter is solving problems in real-time to reveal what’s possible. Helping communities and people thrive. This is Data Driven Leadership, a show brought to you by Resultant.
…
continue reading
Flash Forward is a show about possible (and not so possible) future scenarios. What would the warranty on a sex robot look like? How would diplomacy work if we couldn’t lie? Could there ever be a fecal transplant black market? (Complicated, it wouldn’t, and yes, respectively, in case you’re curious.) Hosted and produced by award winning science journalist Rose Eveleth, each episode combines audio drama and journalism to go deep on potential tomorrows, and uncovers what those futures might re ...
…
continue reading
Android Backstage, a podcast by and for Android developers. Hosted by developers from the Android engineering team, this show covers topics of interest to Android programmers, with in-depth discussions and interviews with engineers on the Android team at Google. Subscribe to Android Developers YouTube → https://goo.gle/AndroidDevs
…
continue reading
This is the audio podcast version of Troy Hunt's weekly update video published here: https://www.troyhunt.com/tag/weekly-update/
…
continue reading
We help founders make something people want.
…
continue reading
WSJ’s Bold Names brings you conversations with the leaders of the bold-named companies featured in the pages of The Wall Street Journal. Hosts Tim Higgins and Christopher Mims speak to CEOs and business leaders in interviews that challenge conventional wisdom and take you inside the decisions being made in the C-suite and beyond.
…
continue reading
Redefining AI is the 2024 New York Digital Award winning tech podcast! Discover a whole new take on Artificial Intelligence in joining host Lauren Hawker Zafer, a top voice in Artificial Intelligence on LinkedIn, for insightful chats that unravel the fascinating world of tech innovation, use case exploration and AI knowledge. Dive into candid discussions with accomplished industry experts and established academics. With each episode, you'll expand your grasp of cutting-edge technologies and ...
…
continue reading
From the construction of virtual realities to the internet of things to the watches on our wrists—technology's influence is everywhere. Its role in our lives is evolving fast, and we're faced with riveting questions and tough challenges that sit at the intersection of technology and humanity. Listen in every Friday, with host, journalist Sherrell Dorsey, as TED speakers explore the way tech shapes how we think about society, science, design, business, and more. Follow Sherrell on Instagram @ ...
…
continue reading
The American healthcare system is one of the most innovative in the world. But it’s also riddled with complex challenges, such as access to affordable medications, inefficiency and administrative burdens, and communication barriers between providers. There’s clearly a better way—and at Surescripts, we have a unique sightline into what that may be. In this series, host Melanie Marcus, Chief Marketing Officer of Surescripts, sits down with today’s most inspiring and innovative leaders in healt ...
…
continue reading
Player FM - Podcast App
Go offline with the Player FM app!
Go offline with the Player FM app!

))
[Linkpost] “A deep critique of AI 2027’s bad timeline models” by titotal
Manage episode 489788702 series 3281452
Content provided by EA Forum Team. All podcast content including episodes, graphics, and podcast descriptions are uploaded and provided directly by EA Forum Team or their podcast platform partner. If you believe someone is using your copyrighted work without your permission, you can follow the process outlined here https://ppacc.player.fm/legal.
This is a link post.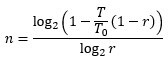


…
continue reading
Thank you to Arepo and Eli Lifland for looking over this article for errors.
I am sorry that this article is so long. Every time I thought I was done with it I ran into more issues with the model, and I wanted to be as thorough as I could. I’m not going to blame anyone for skimming parts of this article.
Note that the majority of this article was written before Eli's updated model was released (the site was updated june 8th). His new model improves on some of my objections, but the majority still stand.
Introduction:
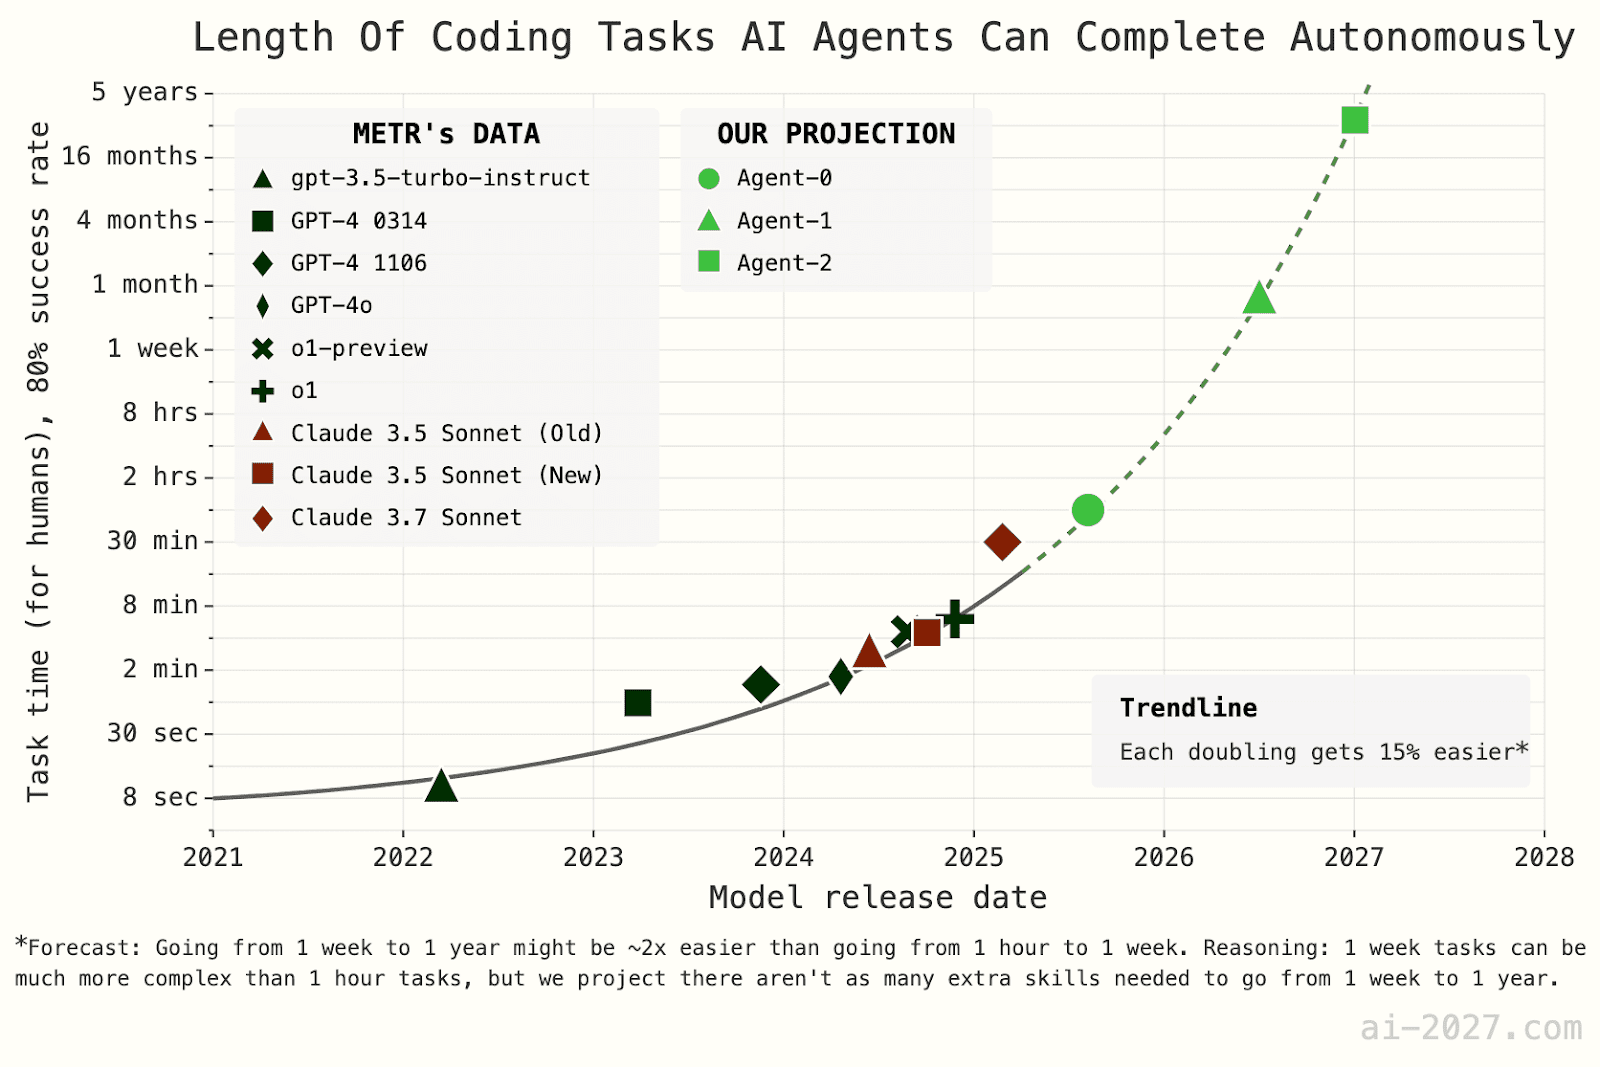
AI 2027 is an article written by the “AI futures team”. The primary piece is a short story penned by Scott Alexander, depicting a month by month scenario of a near-future where AI becomes superintelligent in 2027,proceeding to automate the entire economy in only [...]
---
Outline:
(00:45) Introduction:
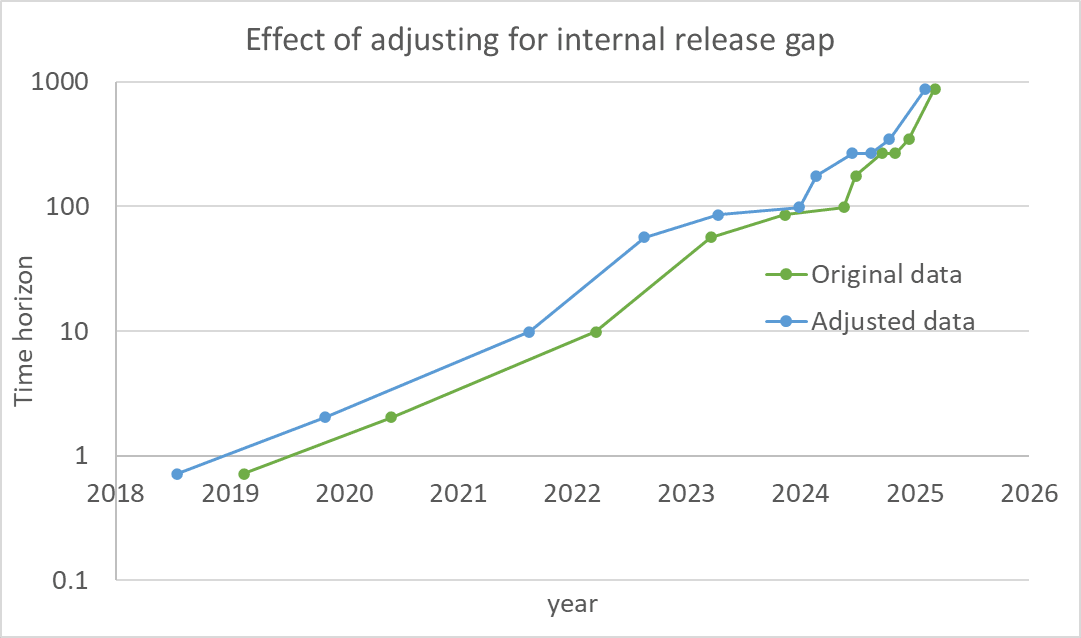
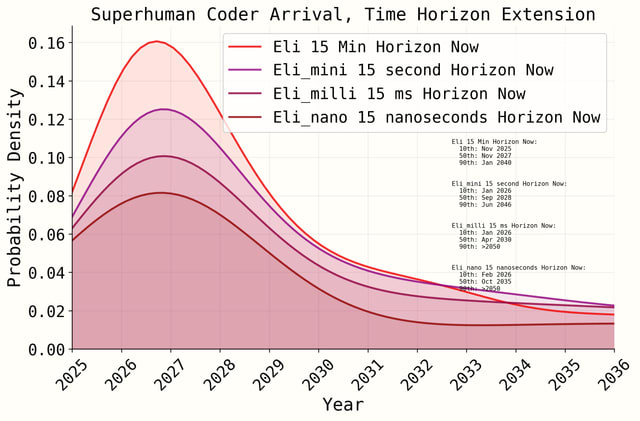
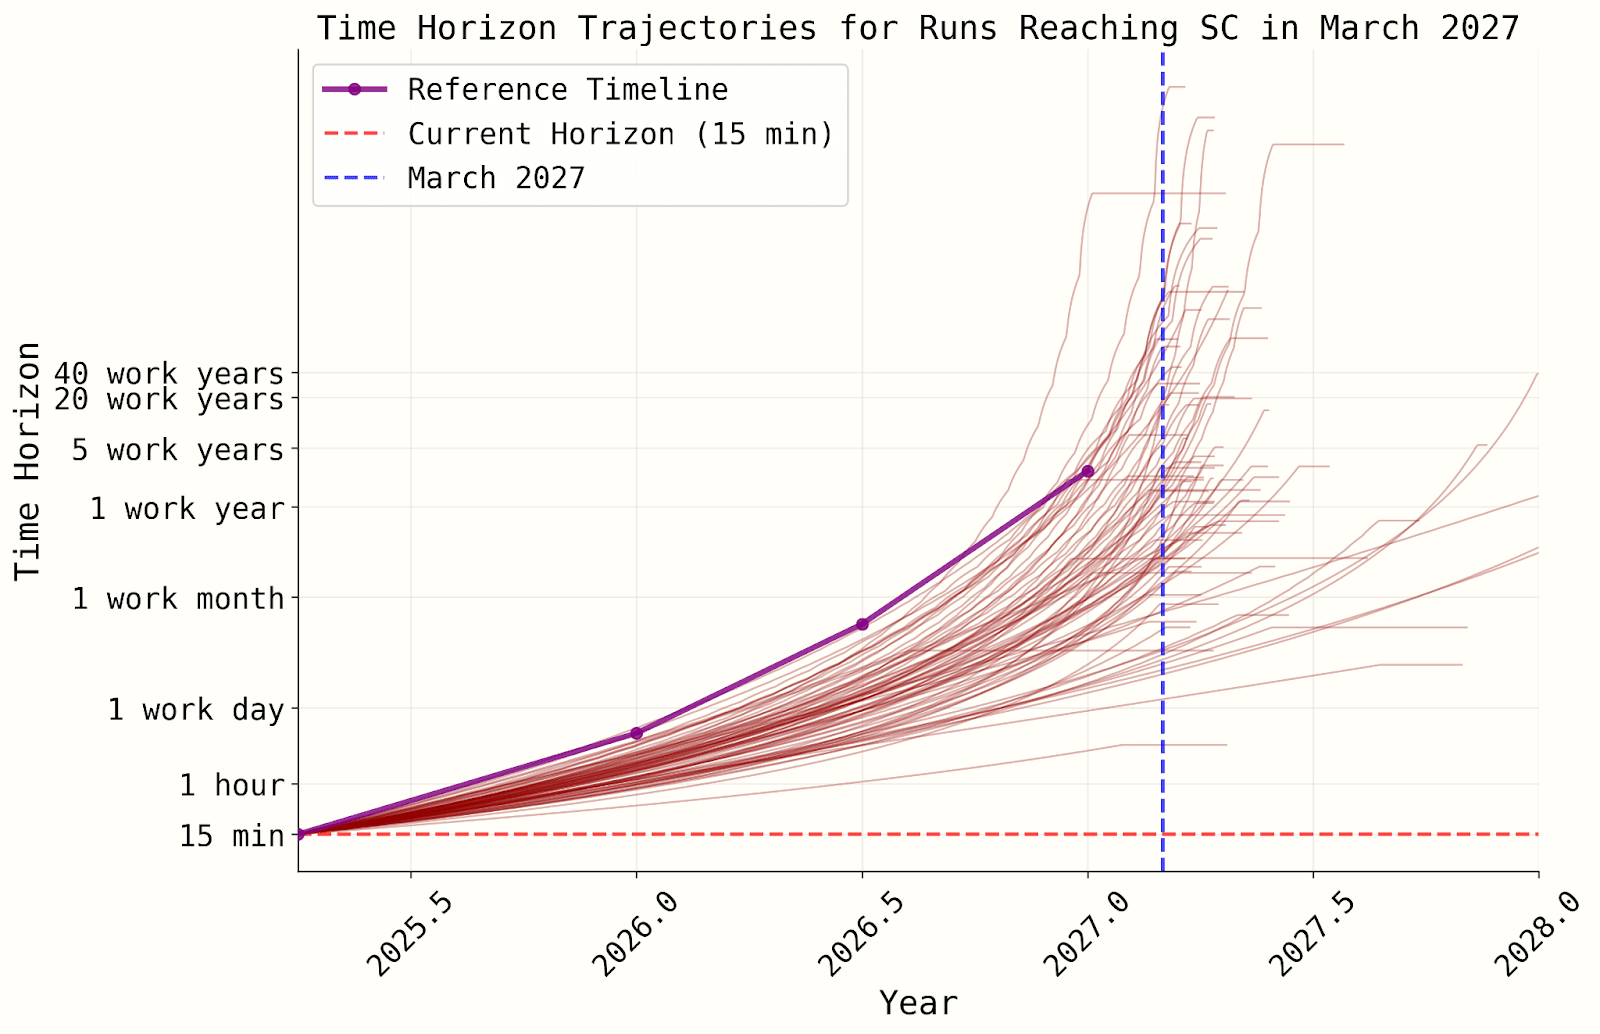
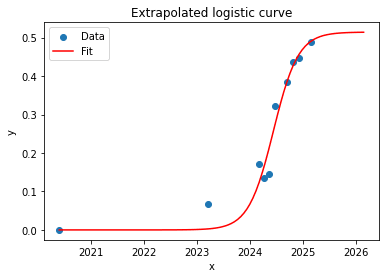
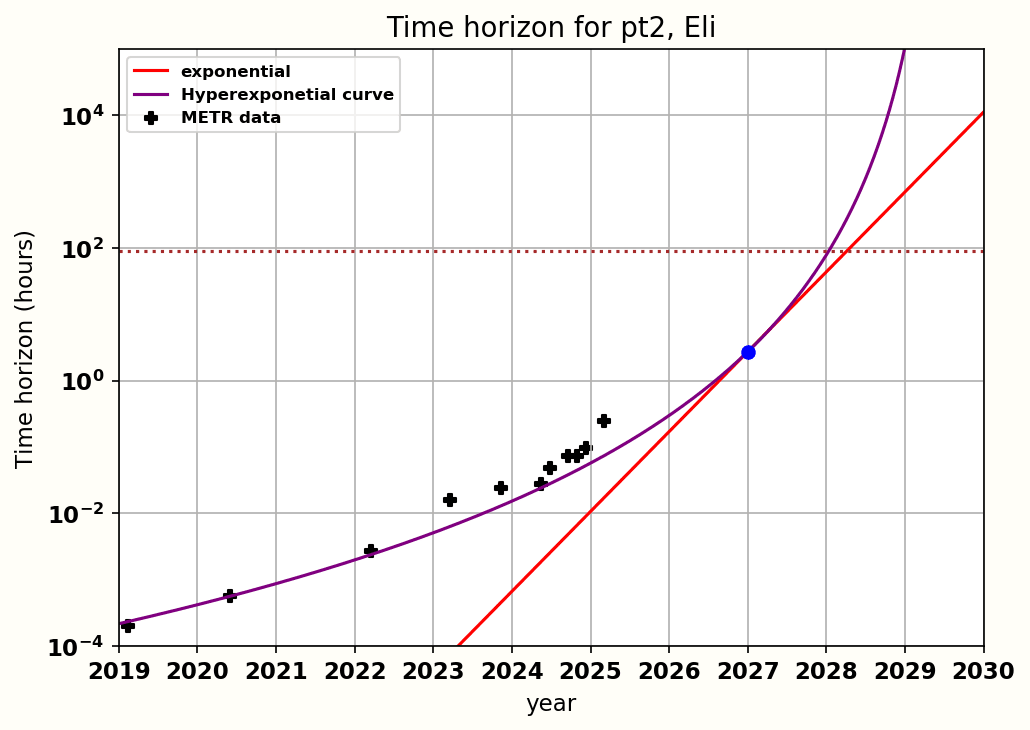
(05:27) Part 1: Time horizons extension model
(05:33) Overview of their forecast
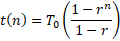
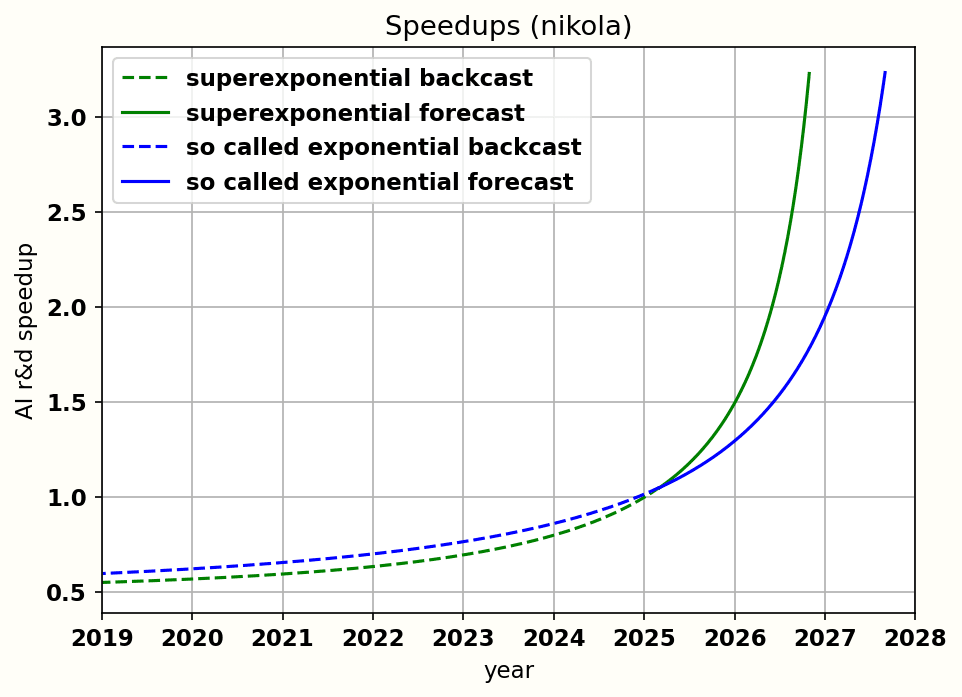
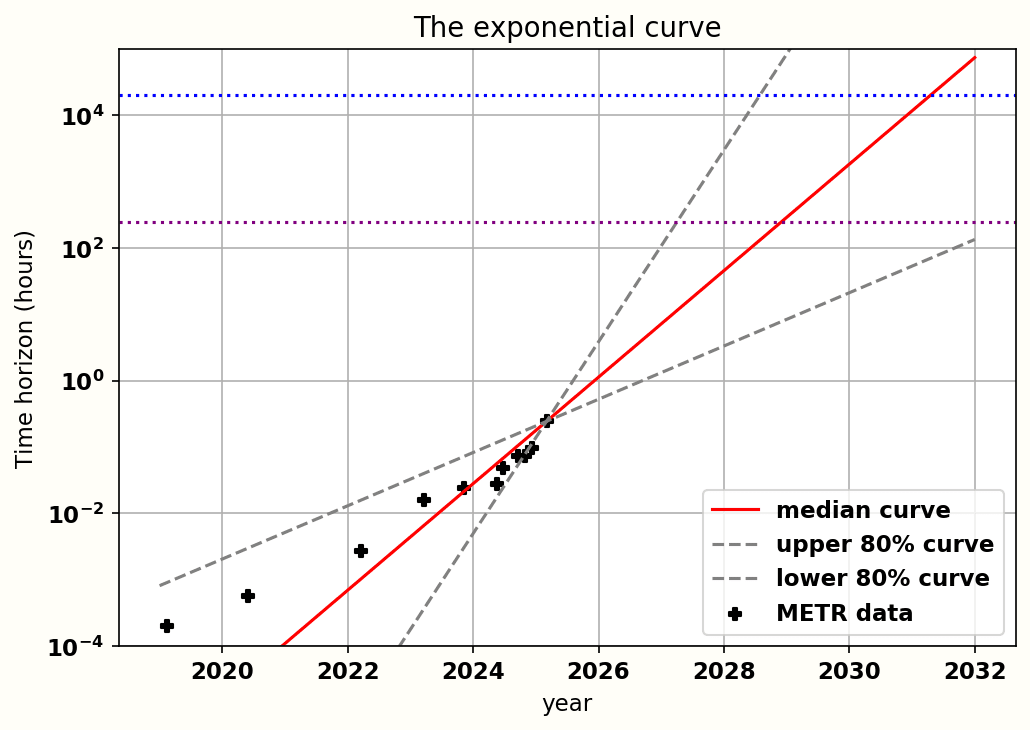
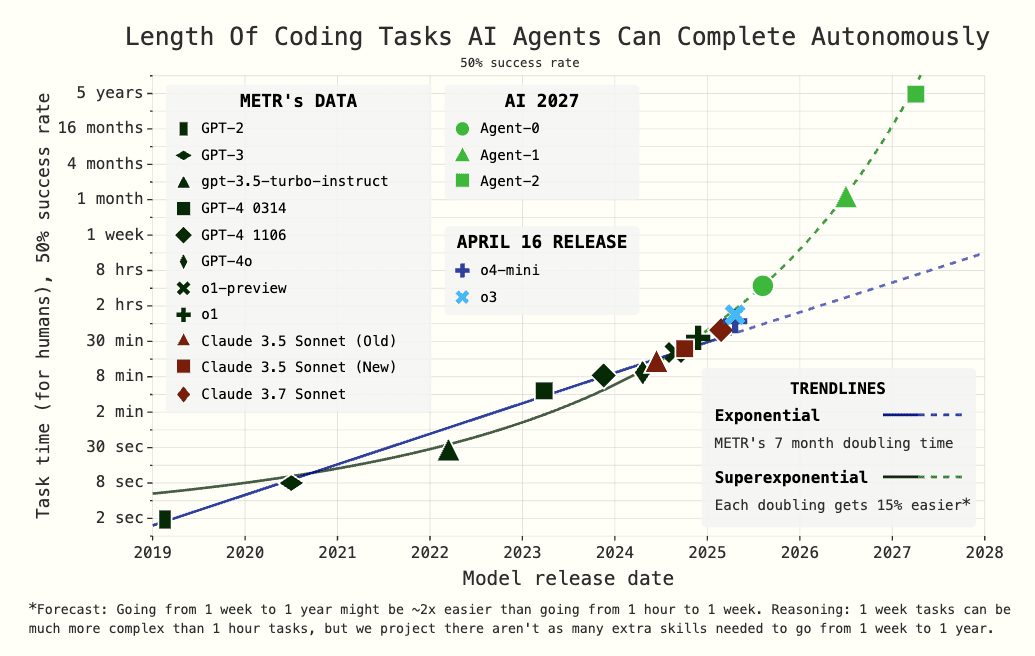
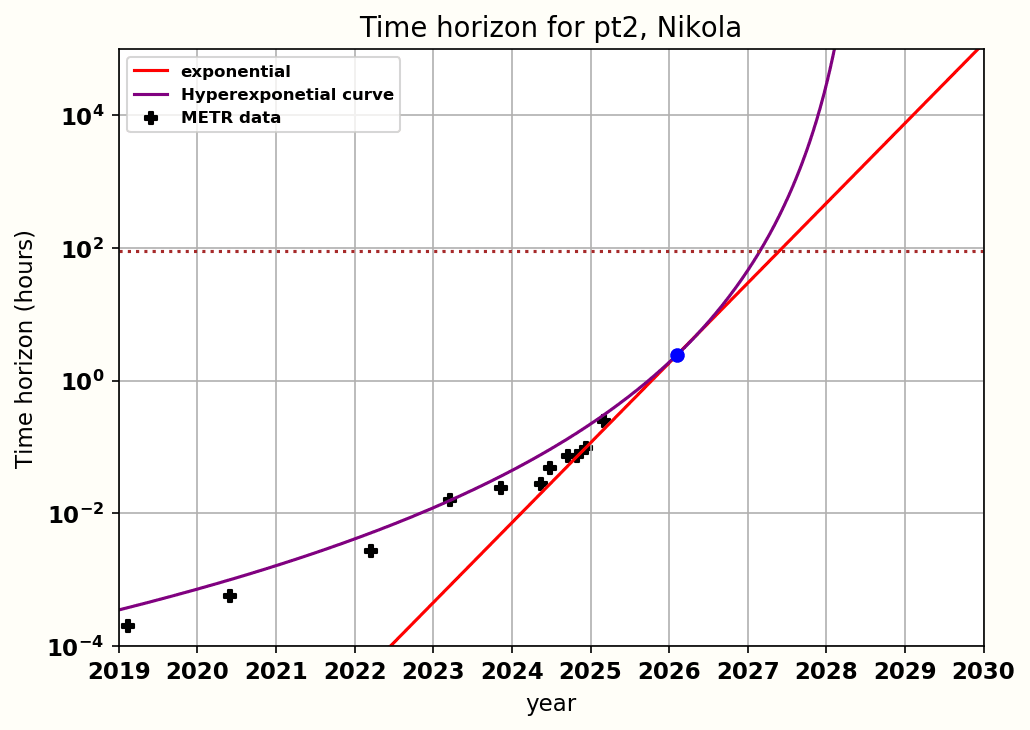
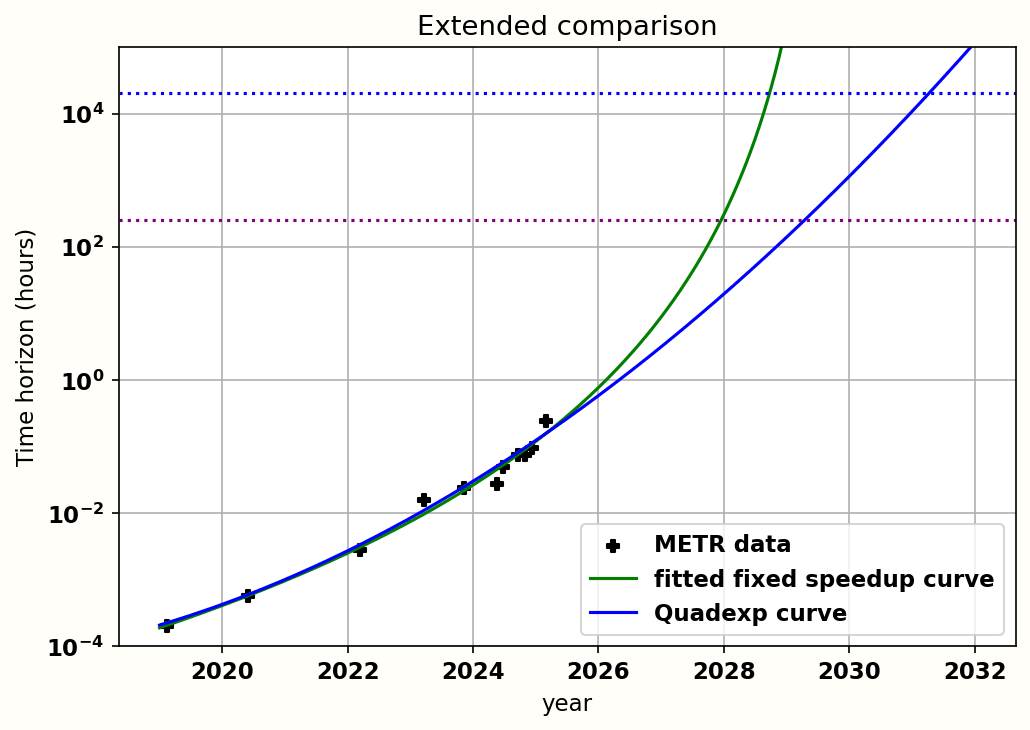
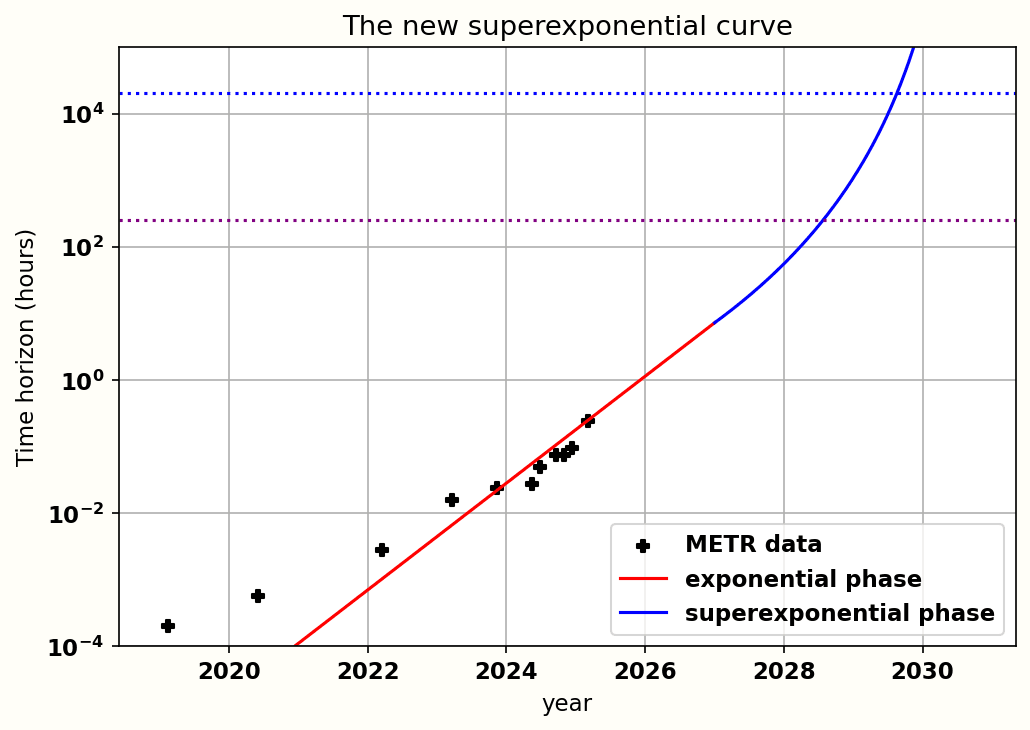
(10:23) The exponential curve
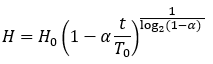
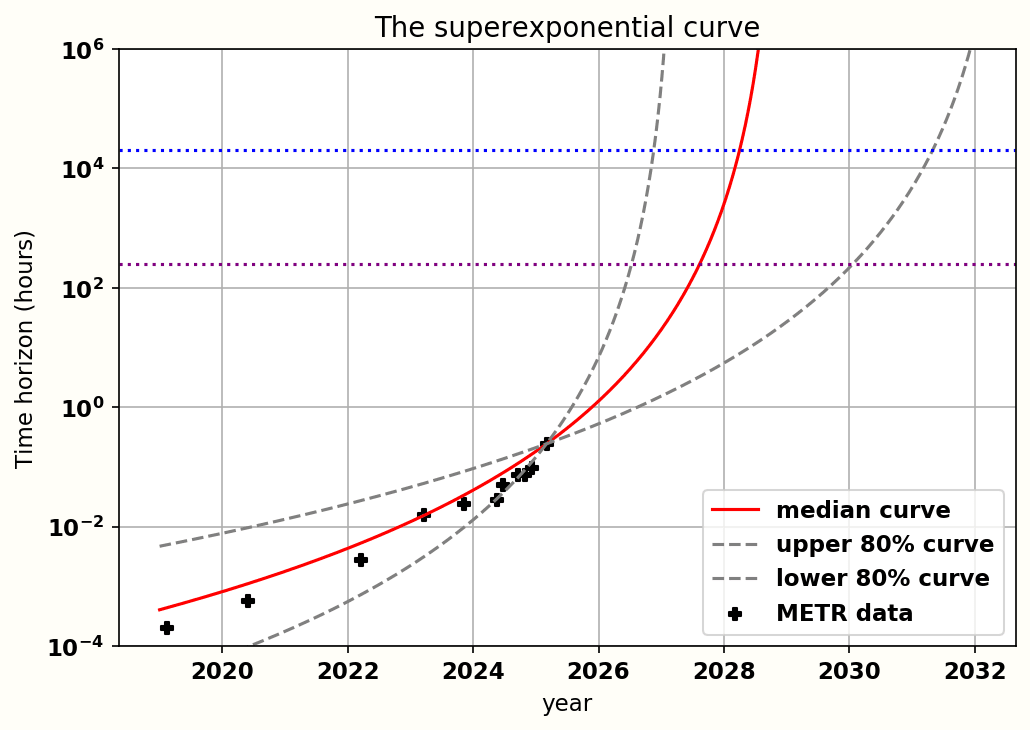
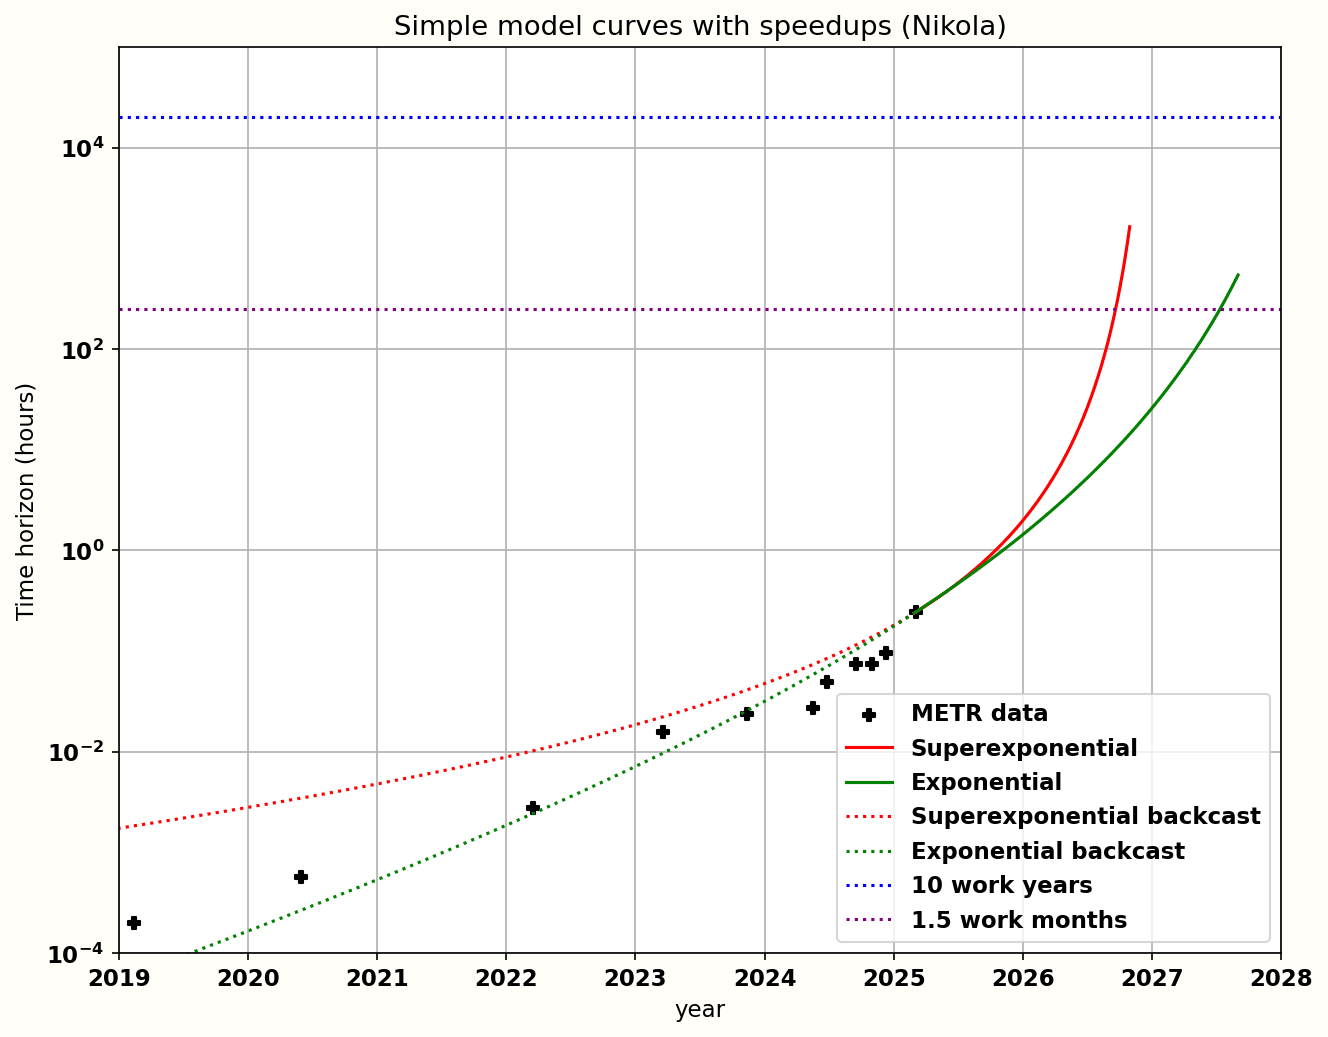
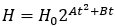
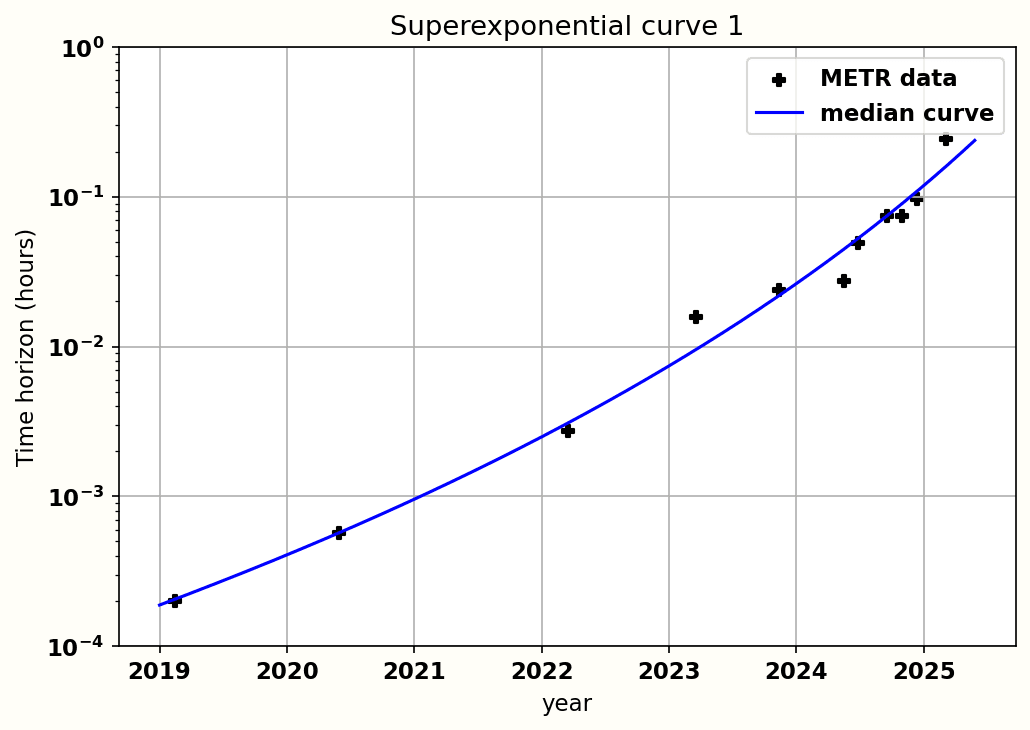
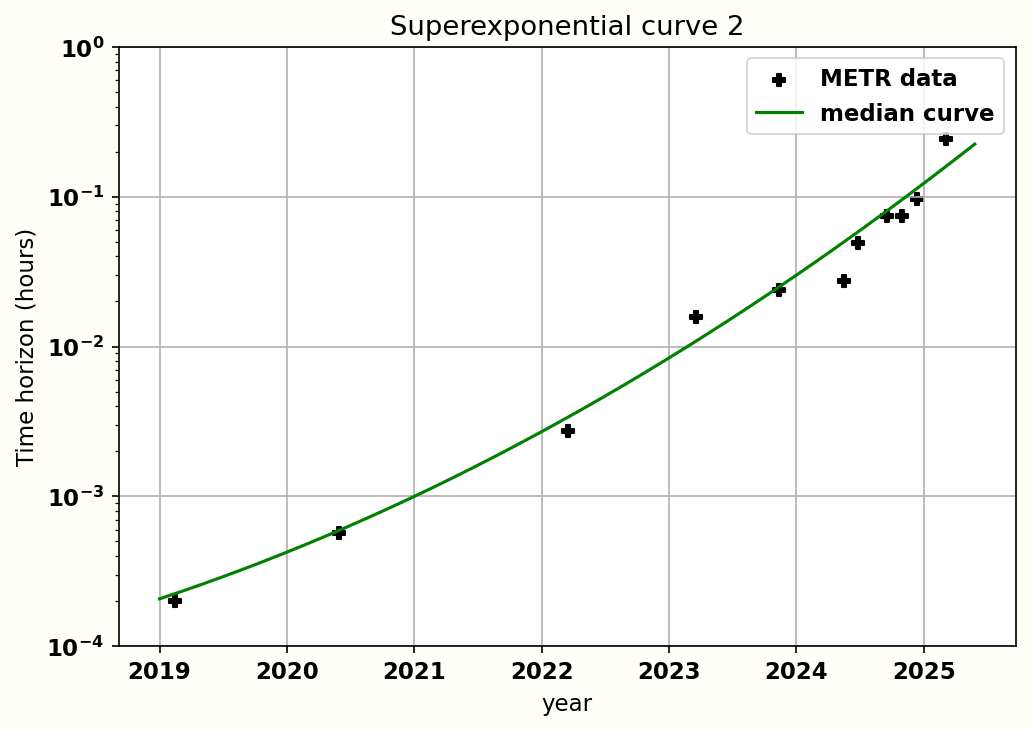
(13:25) The superexponential curve
(20:20) Conceptual reasons:
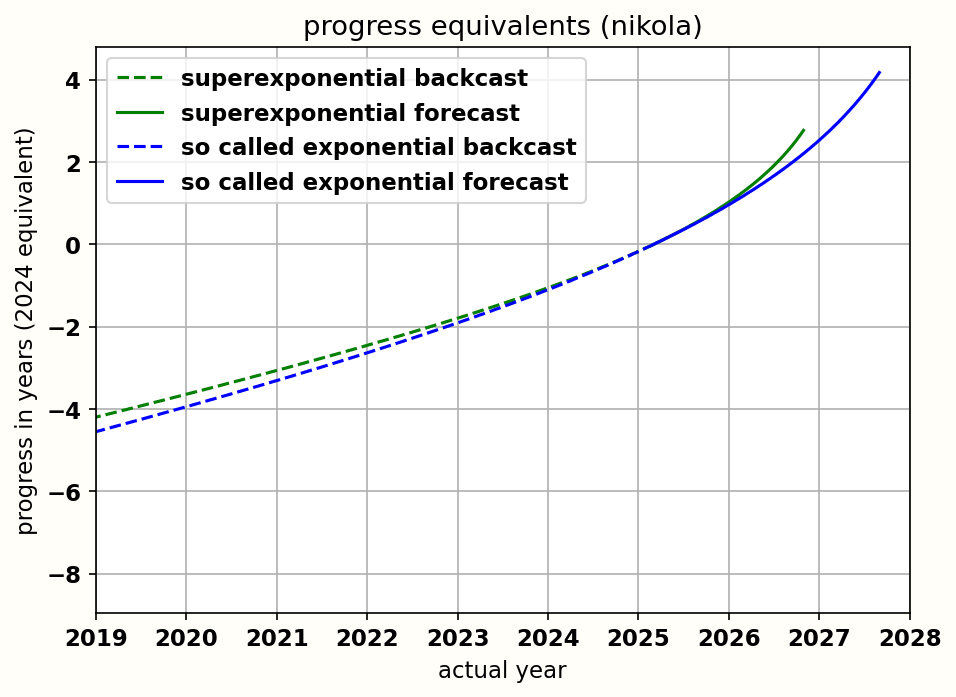
(28:38) Intermediate speedups
(36:00) Have AI 2027 been sending out a false graph?
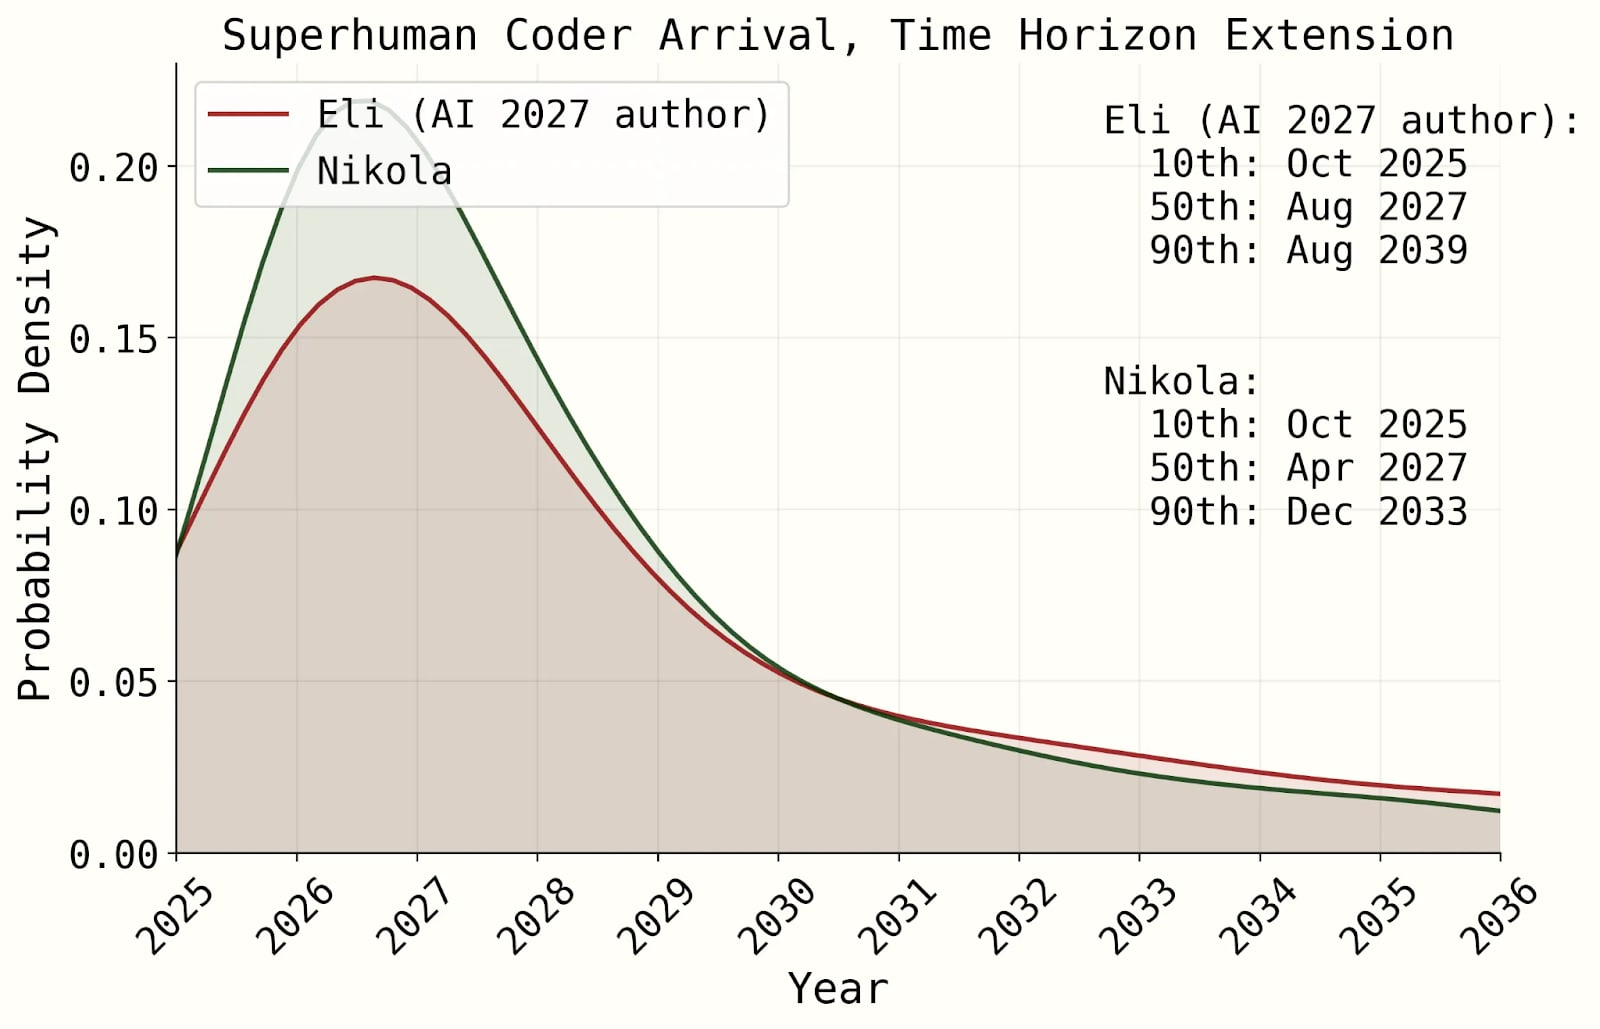
(41:50) Some skepticism about projection
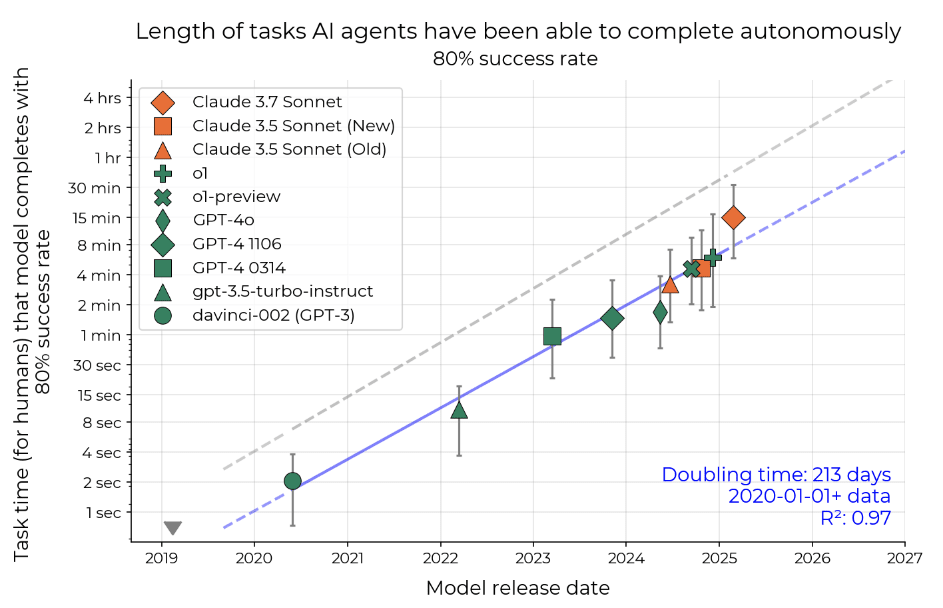
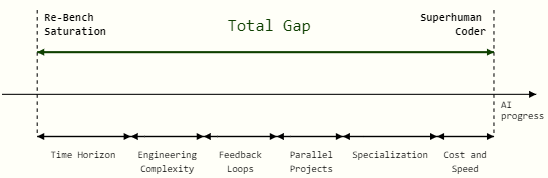
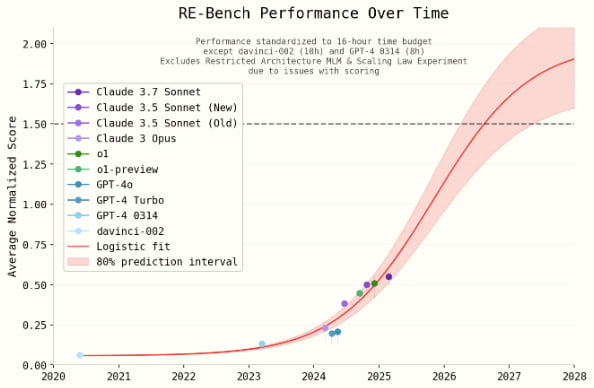
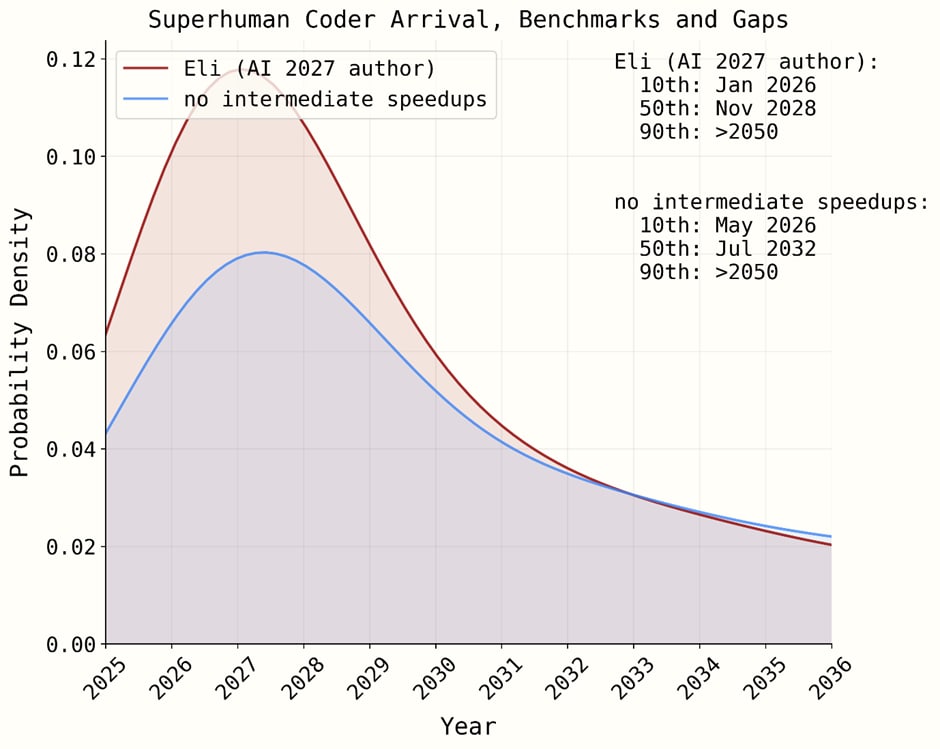
(46:13) Part 2: Benchmarks and gaps and beyond
(46:19) The benchmark part of benchmark and gaps:
(52:53) The time horizon part of the model
(58:02) The gap model
(01:00:58) What about Eli's recent update?
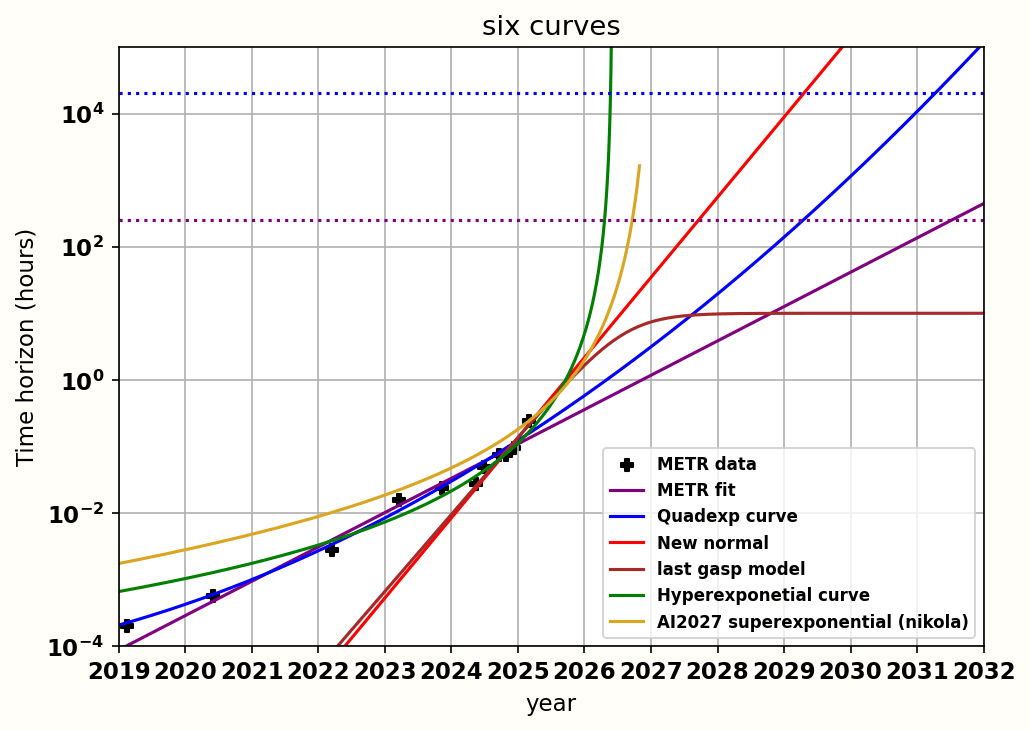
(01:05:19) Six stories that fit the data
(01:10:46) Conclusion
The original text contained 11 footnotes which were omitted from this narration.
---
First published:
June 19th, 2025
Linkpost URL:
https://titotal.substack.com/p/a-deep-critique-of-ai-2027s-bad-timeline
---
Narrated by TYPE III AUDIO.
---
Images from the article:
Apple Podcasts and Spotify do not show images in the episode description. Try Pocket Casts, or another podcast app.
256 episodes
Manage episode 489788702 series 3281452
Content provided by EA Forum Team. All podcast content including episodes, graphics, and podcast descriptions are uploaded and provided directly by EA Forum Team or their podcast platform partner. If you believe someone is using your copyrighted work without your permission, you can follow the process outlined here https://ppacc.player.fm/legal.
This is a link post.
…
continue reading
Thank you to Arepo and Eli Lifland for looking over this article for errors.
I am sorry that this article is so long. Every time I thought I was done with it I ran into more issues with the model, and I wanted to be as thorough as I could. I’m not going to blame anyone for skimming parts of this article.
Note that the majority of this article was written before Eli's updated model was released (the site was updated june 8th). His new model improves on some of my objections, but the majority still stand.
Introduction:
AI 2027 is an article written by the “AI futures team”. The primary piece is a short story penned by Scott Alexander, depicting a month by month scenario of a near-future where AI becomes superintelligent in 2027,proceeding to automate the entire economy in only [...]
---
Outline:
(00:45) Introduction:
(05:27) Part 1: Time horizons extension model
(05:33) Overview of their forecast
(10:23) The exponential curve
(13:25) The superexponential curve
(20:20) Conceptual reasons:
(28:38) Intermediate speedups
(36:00) Have AI 2027 been sending out a false graph?
(41:50) Some skepticism about projection
(46:13) Part 2: Benchmarks and gaps and beyond
(46:19) The benchmark part of benchmark and gaps:
(52:53) The time horizon part of the model
(58:02) The gap model
(01:00:58) What about Eli's recent update?
(01:05:19) Six stories that fit the data
(01:10:46) Conclusion
The original text contained 11 footnotes which were omitted from this narration.
---
First published:
June 19th, 2025
Linkpost URL:
https://titotal.substack.com/p/a-deep-critique-of-ai-2027s-bad-timeline
---
Narrated by TYPE III AUDIO.
---
Images from the article:
Apple Podcasts and Spotify do not show images in the episode description. Try Pocket Casts, or another podcast app.
256 episodes
All episodes
×Welcome to Player FM!
Player FM is scanning the web for high-quality podcasts for you to enjoy right now. It's the best podcast app and works on Android, iPhone, and the web. Signup to sync subscriptions across devices.
Similar to EA Forum Podcast (Curated & popular)
Show notes are at https://stevelitchfield.com/sshow/chat.html
…
continue reading
The power of Data is undeniable. And unharnessed - it’s nothing but chaos. Making data your ally. Using it to lead with confidence and clarity. Host Jess Carter is solving problems in real-time to reveal what’s possible. Helping communities and people thrive. This is Data Driven Leadership, a show brought to you by Resultant.
…
continue reading
Flash Forward is a show about possible (and not so possible) future scenarios. What would the warranty on a sex robot look like? How would diplomacy work if we couldn’t lie? Could there ever be a fecal transplant black market? (Complicated, it wouldn’t, and yes, respectively, in case you’re curious.) Hosted and produced by award winning science journalist Rose Eveleth, each episode combines audio drama and journalism to go deep on potential tomorrows, and uncovers what those futures might re ...
…
continue reading
Android Backstage, a podcast by and for Android developers. Hosted by developers from the Android engineering team, this show covers topics of interest to Android programmers, with in-depth discussions and interviews with engineers on the Android team at Google. Subscribe to Android Developers YouTube → https://goo.gle/AndroidDevs
…
continue reading
This is the audio podcast version of Troy Hunt's weekly update video published here: https://www.troyhunt.com/tag/weekly-update/
…
continue reading
We help founders make something people want.
…
continue reading
WSJ’s Bold Names brings you conversations with the leaders of the bold-named companies featured in the pages of The Wall Street Journal. Hosts Tim Higgins and Christopher Mims speak to CEOs and business leaders in interviews that challenge conventional wisdom and take you inside the decisions being made in the C-suite and beyond.
…
continue reading
Redefining AI is the 2024 New York Digital Award winning tech podcast! Discover a whole new take on Artificial Intelligence in joining host Lauren Hawker Zafer, a top voice in Artificial Intelligence on LinkedIn, for insightful chats that unravel the fascinating world of tech innovation, use case exploration and AI knowledge. Dive into candid discussions with accomplished industry experts and established academics. With each episode, you'll expand your grasp of cutting-edge technologies and ...
…
continue reading
From the construction of virtual realities to the internet of things to the watches on our wrists—technology's influence is everywhere. Its role in our lives is evolving fast, and we're faced with riveting questions and tough challenges that sit at the intersection of technology and humanity. Listen in every Friday, with host, journalist Sherrell Dorsey, as TED speakers explore the way tech shapes how we think about society, science, design, business, and more. Follow Sherrell on Instagram @ ...
…
continue reading
The American healthcare system is one of the most innovative in the world. But it’s also riddled with complex challenges, such as access to affordable medications, inefficiency and administrative burdens, and communication barriers between providers. There’s clearly a better way—and at Surescripts, we have a unique sightline into what that may be. In this series, host Melanie Marcus, Chief Marketing Officer of Surescripts, sits down with today’s most inspiring and innovative leaders in healt ...
…
continue reading
Player FM - Podcast App
Go offline with the Player FM app!
Go offline with the Player FM app!